
Your Data, Our Software, AI Unlocked.
Using our proprietary camera, data, and AI software, we unlock the full picture of what's going on within your organization and give your team tools to act on it.
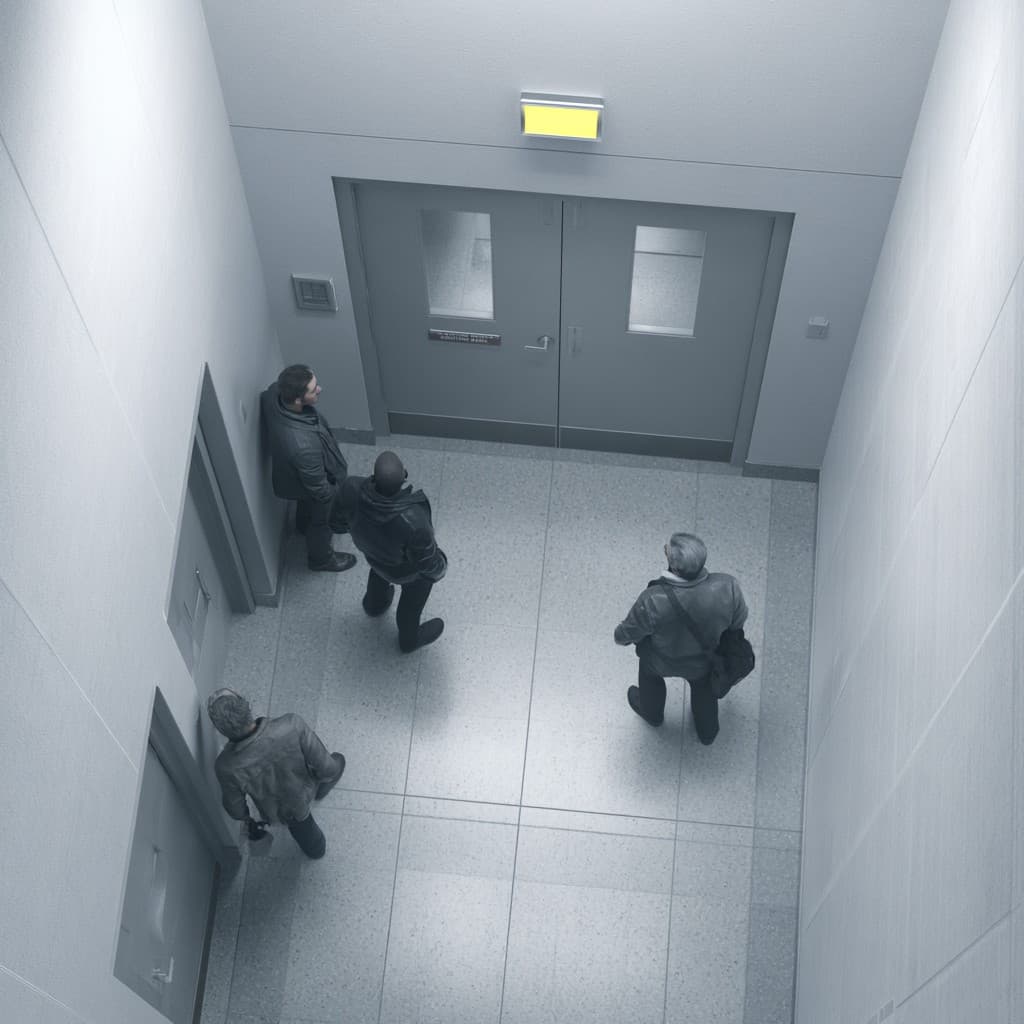
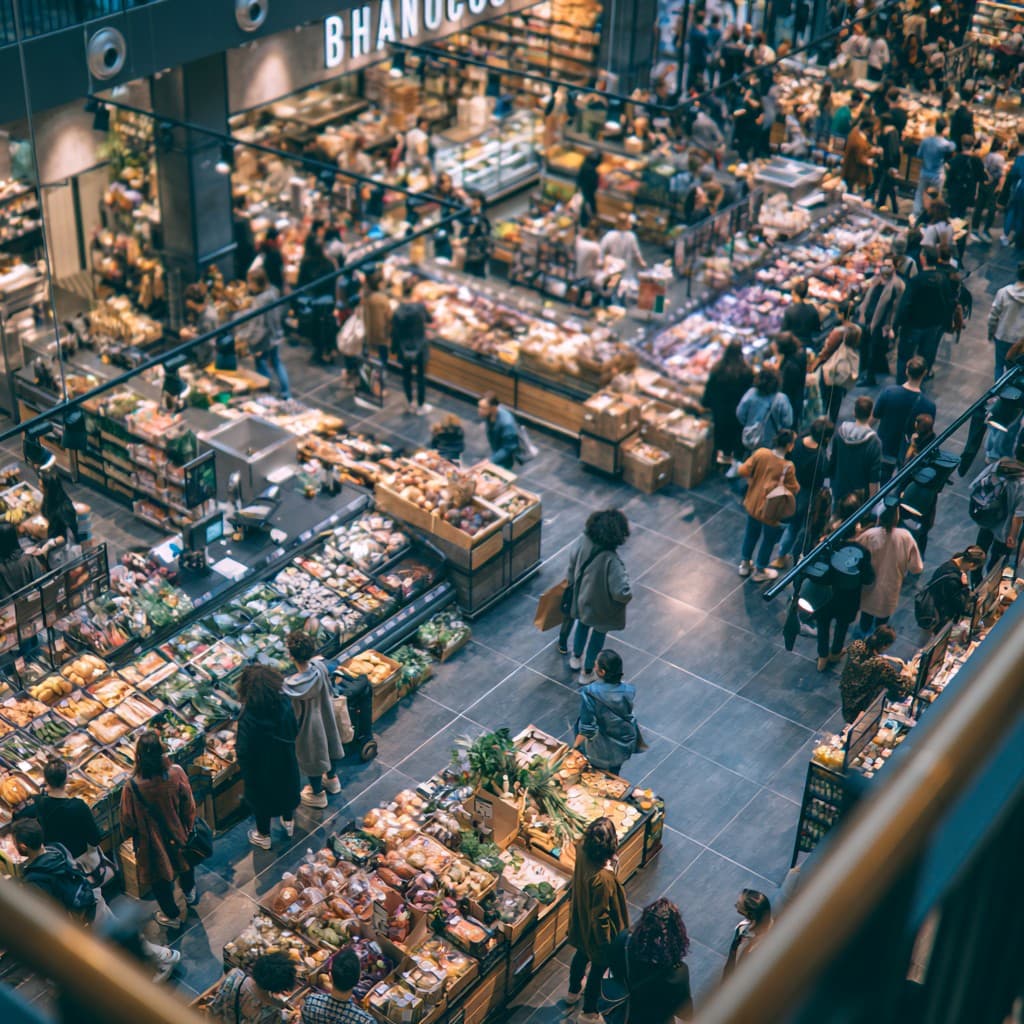
Sentinel Solutions builds data and security infrastructure tools for schools, government facilities, apartment communities, office campuses, and venues.
Our system sits between you and your existing data: collecting, organizing, analyzing, and then giving you tools to make more informed decisions faster.
Two Sentinel Products
Your existing data could tell you the full picture. Our system lets you see it.
Point of sale, security footage, scheduling, ticketing, ERP: the data already exists, scattered across tools few people check.
Our Process:
Enterprise · Custom Models
Your own models, trained on your own data.
Here's how it works: we fine-tune open-source AI models for your organization using the same proprietary training tools we built our own camera models with. Everything runs on closed systems: your model is trained on your data alone, and nothing is ever shared between clients.
Live Product Example: Valet Tracking
Guests
412
Guests seen at the valet stand in this window
At the valet now
6
On camera within the last 60 seconds
Pass-through time
42s
Quick valet-approach traffic · busiest 7pm
Curb wait benchmark
4m 10s
Longer valet pickup waits can reach this range
What we build depends on what you run. A couple of examples of the kind of metrics that come out of this, by industry.
Hospitals*
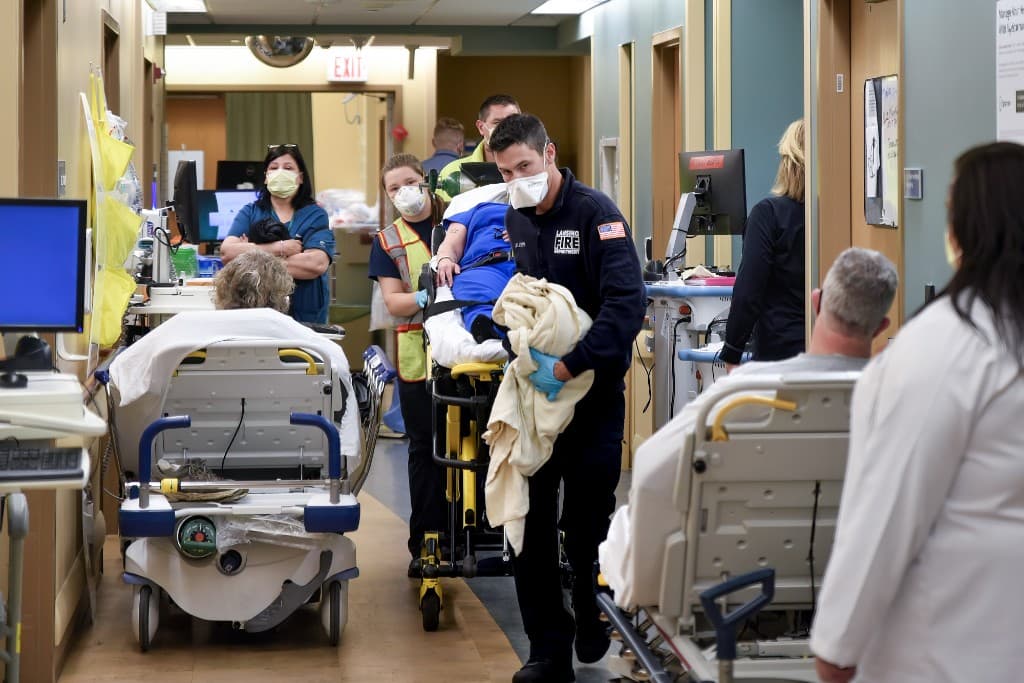
- Foot traffic and visitor counts by zone
- ER, registration, and pharmacy wait times
- Service speed from check-in to treatment
- Occupancy and peak-concurrent per zone
- How patients actually move through the building
- Automated alerts before a waiting room boils over
Hospitality*
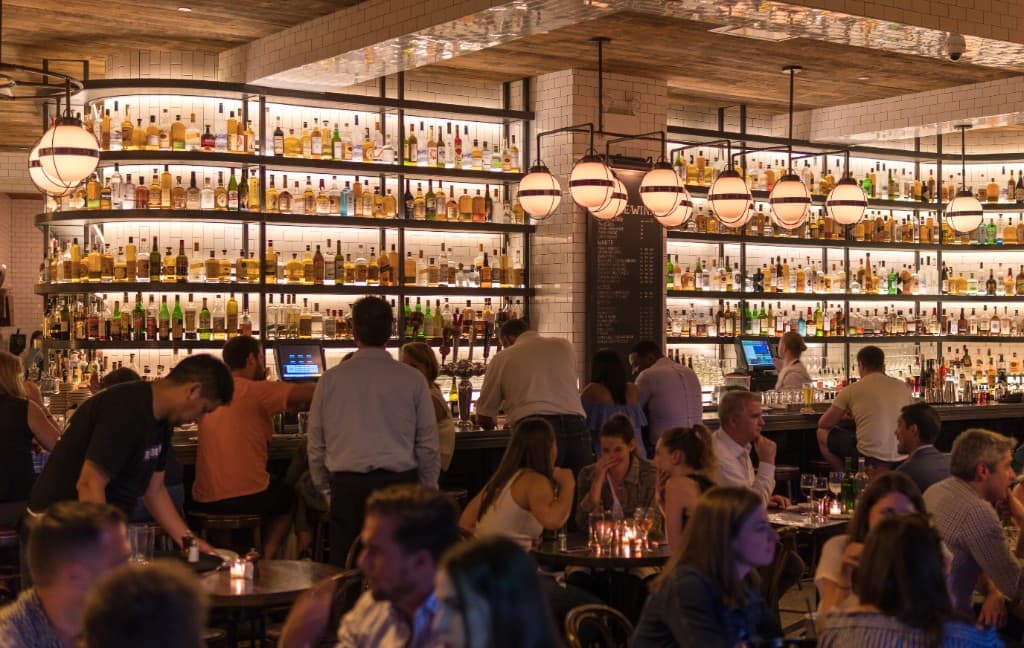
- Kitchen prep efficiency and ticket-to-table timing
- Bar busyness and pour pace by hour
- Valet efficiency: drop-off to keys, retrieval times
- Host-stand queue length and walk-away rate
- Table turn time by section
- Day-of-week and hour heatmaps for staffing
*These lists are for conceptual purposes and are not, in most cases, active systems we sell. Each enterprise client gets a custom solution tailored to their data needs.
What Sentinel is looking for.
Count visitors by hour, day, entrance, and zone.
Queue length and wait at checkouts, bars, and counters. Alert on climb.
Bar-to-drink, kitchen-to-table, checkout-to-exit, measured continuously.
Track how long people linger in each area and when peaks form.
See where visitors go inside your venue, and where they don’t.
Run a promo, watch the lift in traffic the same afternoon.
Curious what the other side looks like?
Schedule a Briefing
Capped annual spend, guaranteed. If you hit the cap, the system stays online at our expense.